

Roast Studio
Roast Studio is where you record a Batch in real time. It opens as a separate window and moves through three steps, shown at the top of the window: Plan → BBP → Roast.
You open Roast Studio from a Plan detail page by clicking Open in Roast Studio, from the Plans list by clicking Roast without a Plan, or from anywhere with the keyboard sequence G then R.
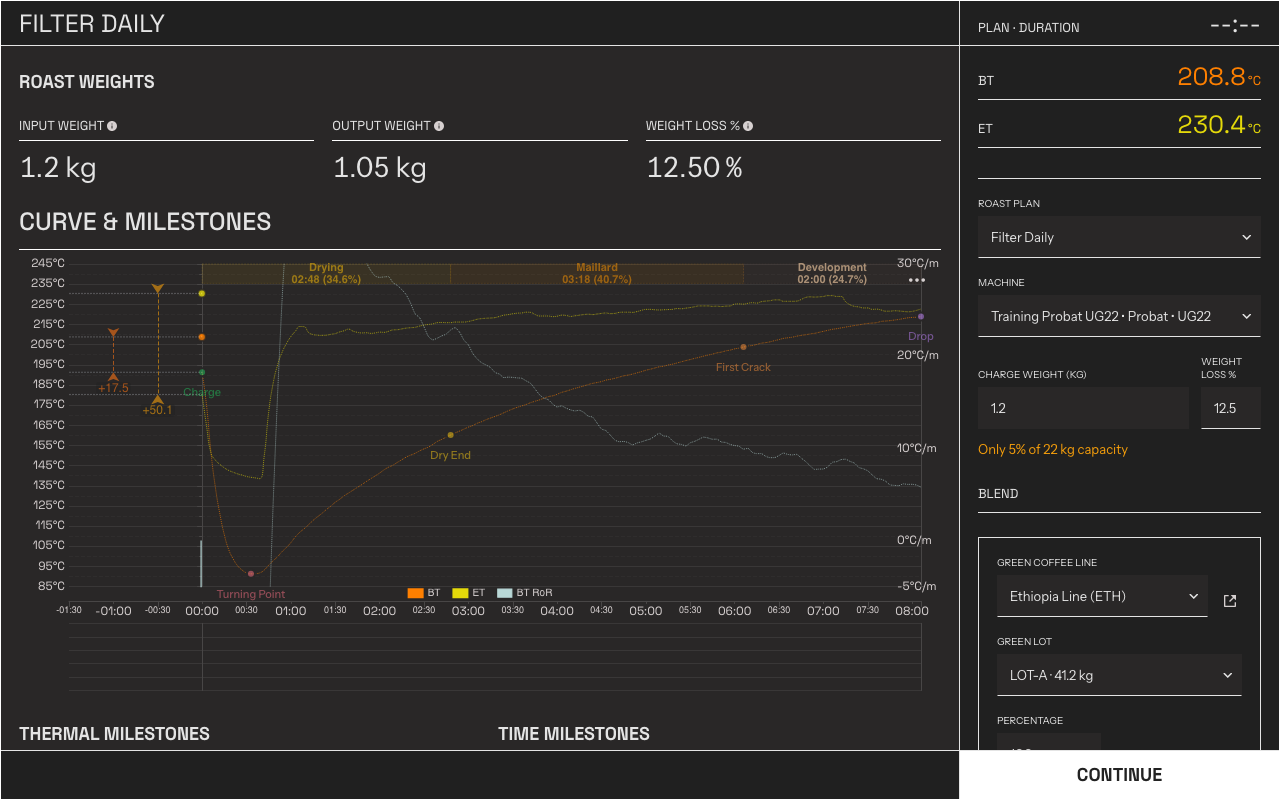
The Plan step. The sidebar holds the Plan, Machine, and weight fields; the main area previews the Curve.
Step 1 — Plan
Section titled “Step 1 — Plan”Before the Batch starts, confirm or adjust the setup in the sidebar:
- Roast Plan — the Plan for this Batch, pre-filled if you opened Roast Studio from one. You can change it or roast without a Plan.
- Machine — the Machine for this Batch.
- Charge weight — the green coffee weight going in. Rostoc uses it for stock validation and consumption tracking; you can also continue without it.
- Weight loss % — the expected loss, used to estimate the output weight.
- Blend — the green Lots this Batch consumes. For a blend, each Coffee Line and its share is listed. If a linked Lot is running low, a stock warning appears here.
The main area shows the Curve preview with the Plan’s Reference Curve and milestone targets. To adjust how the Machine’s channels are drawn, open the ⋯ menu in the chart’s corner and choose Chart style — it opens the Machine’s Style & Colors settings, and the menu stays available in every step, including mid-roast. The same menu holds the Show BBP switch, which controls whether the pre-charge window stays visible on the chart.
When everything looks right, click Continue.
Step 2 — BBP
Section titled “Step 2 — BBP”The BBP step covers the time between batches, while the Machine heats or recovers and no Batch is recording yet. You can see live readings before any beans go in:
- Live BT and ET values and their Rate of Rise.
- A summary of the selected Plan: coffee, batch size, drop target, duration.
- Machine State — whether the Machine is connected and telemetry is flowing.
If a reading stalls — the Machine stops sending fresh values — its readout drains to gray. The last known number stays legible, but you can tell at a glance it is no longer live. Color returns as soon as fresh data arrives.
Hit your target charge temperature
Section titled “Hit your target charge temperature”The Between Batch Protocol (BBP) exists to get the Machine into the right thermal state before the beans go in. During this step the pre-roast Curve is drawn live, and it is stored with the Batch so you can review the lead-up later.
When the Plan has a Reference Curve, its charge temperatures appear as horizontal guide lines on the Curve, with a gap indicator between the current Machine temperature and the target — the arrow grows with the gap and shrinks as you close it. Charge when the gap reaches zero, and back-to-back Batches start from the same thermal state.
Click Start when you charge the beans — or, with Auto Charge on, click Start first and let Rostoc detect the charge and start the roast timer for you. Rostoc watches for the charge for up to 30 seconds; the roast continues in this step until Charge is marked.
Step 3 — Roast
Section titled “Step 3 — Roast”The Roast step is where the Curve is recorded. The header shows the roast timer and live temperatures; the sidebar holds the event buttons.
How the chart draws each channel
Section titled “How the chart draws each channel”The chart places every channel by what it measures:
- Temperatures — Bean and Exhaust Temperature, extra probes, and their Rate of Rise draw on the temperature Curve.
- Temperature targets — a setpoint or limit the Machine reports also belongs to the temperature Curve, drawn as a dashed, stepped line so a thermostat mark never reads as a measurement.
- Machine actions — gas, airflow, drum speed, and other machine-side changes draw in their own chart area below the Curve. Each control is one line: when the Machine echoes your own change back, Rostoc keeps a single history instead of drawing it twice.
The temperature axis follows your measurements. A target beyond that scale — a high safety limit, say — pins to the chart’s edge under a small marker that carries the real value (for example Limit: 600 ▲); the tooltip always has the exact numbers, and near the chart’s edges it flips and slides to stay in view.
Rostoc assigns every channel’s color from its own palette — including Machines set up from an imported settings file — and a saved Batch is drawn with the same colors you saw live. To restyle a channel, open the chart’s ⋯ menu and choose Chart style: temperature channels are listed under Measurements, and the lower chart’s channels under Actions.
The live chart keeps at least the last thirty minutes on screen. The recording itself is never trimmed — however long the roast, the full Curve is saved with the Batch.
Rate of Rise
Section titled “Rate of Rise”Rate of Rise (RoR) is how fast bean and environment temperature are climbing. Rostoc shows it in two places, from the moment telemetry starts flowing during BBP:
- Δ BT and Δ ET readouts under the BT and ET values.
- BT RoR and ET RoR curves on the Curve chart.
Both are read per minute unless you change it. See Rate of Rise Settings to read it over a shorter interval, or to set the scale the curves are drawn against.
Both are on by default and appear once enough readings have arrived to measure a slope. To hide or show either one, click its Δ BT or Δ ET readout, or its entry in the chart legend. Rostoc remembers the choice for your next roast.
RoR is always reported per minute, and the interval is not configurable. If you work in degrees per 30 seconds, halve the number shown.
Mark roast events
Section titled “Mark roast events”Mark milestones as they happen, with the buttons or their keyboard shortcuts:
| Event | Shortcut |
|---|---|
| Charge | C |
| Dry End | Y |
| First Crack | F |
| First Crack End | Shift + F |
| Second Crack | S |
| Second Crack End | Shift + S |
| Drop | D |
Events follow the roast order, and the next expected event is highlighted. Clicking a completed event removes it again, so a mis-click is fixed with a second click.
First Crack End and Second Crack End appear beside the crack they close, as soon as you mark that crack. Both are optional, as is Second Crack itself — you can go straight from First Crack to Drop, as in a lighter roast.
Rostoc can also mark events for you: with Roast automation, Charge, Dry End, First Crack, Second Crack, and Drop can be detected and marked automatically. The crack ends are always marked by hand. Auto Drop only places the Drop mark; you still stop the recording manually.
Log Machine changes
Section titled “Log Machine changes”Log a Machine change on the Curve timeline — these record what you changed on the Machine; they do not send anything to it:
| Change to log | Shortcut |
|---|---|
| Gas | B |
| Airflow | A |
| Drum Speed | R |
Pressing one opens a prompt for the new value.
Machine controls
Section titled “Machine controls”When the selected Machine and connection support direct control, Roast Studio shows live controls — such as gas, airflow, or drum speed — that send real commands to the Machine. Read Machine controls before using them for the first time, including the compatibility requirements and safety guidance.
Press G to show a letter on each available control, then press that letter to jump to it. See Keyboard shortcuts for the full control-editing workflow.
Stop or abort
Section titled “Stop or abort”Click Stop when the roast is finished. A confirmation appears for a few seconds so an accidental click doesn’t end the Batch. After you confirm, the Batch is saved and opens in the main window, where you add the drop weight, color readings, and notes — see Batch details.
Click Abort to end the roast without keeping it. Aborting discards the recording — no Batch and no inventory consumption is recorded.