

Inventory Dashboard
Inventory is the operation, not a summary of it: what you hold, what it is worth, what is on the way, and every movement behind those numbers. Open it from Inventory in the sidebar, or press G then I.
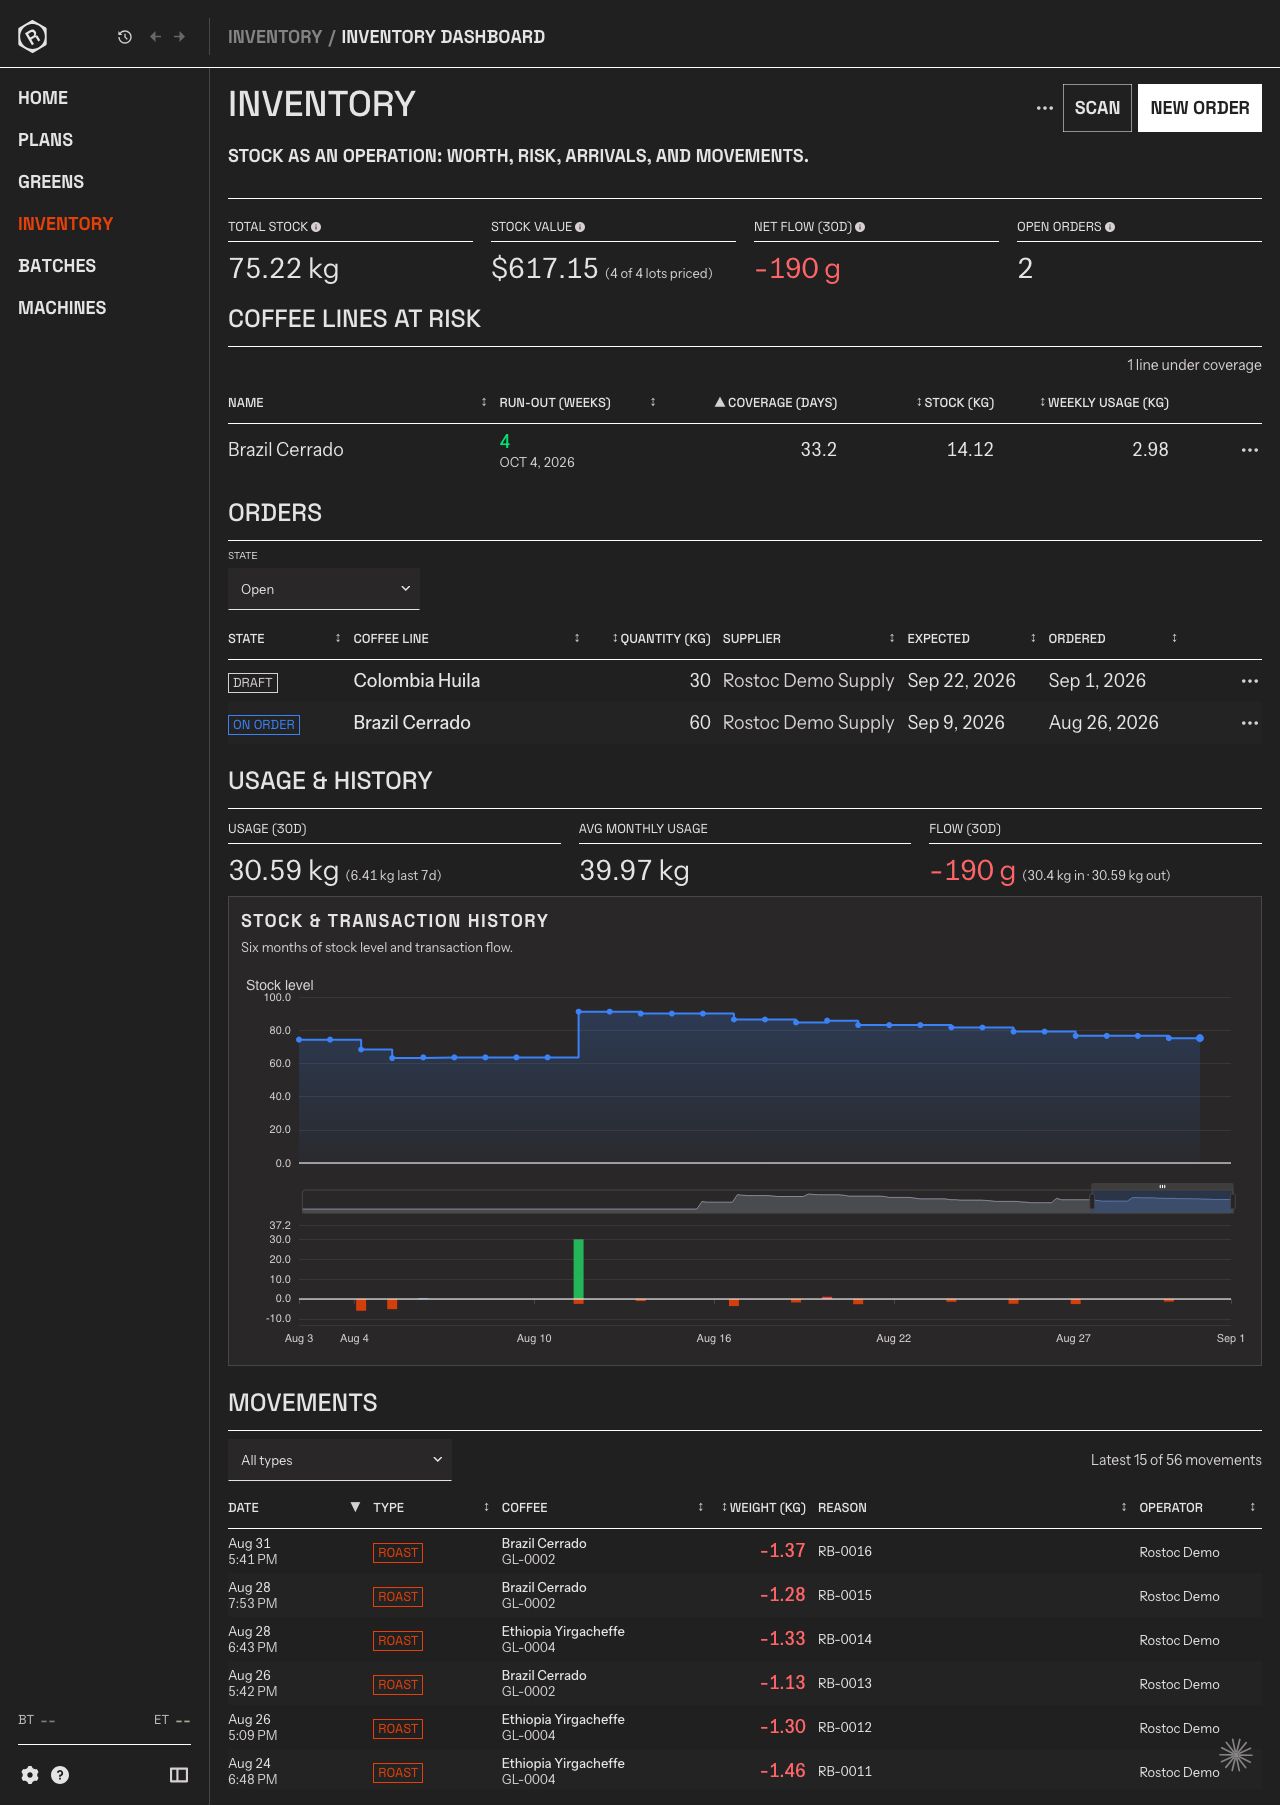
Two buttons sit in the header beside the ⋯ menu: Scan, which opens the scanner for a barcode reader or a printed label, and New Order, which starts an order without going through a Coffee Line first.
The headline figures
Section titled “The headline figures”| Figure | What it shows |
|---|---|
| Total Stock | Current stock across all active Lots |
| Stock Value | Estimated value from the Lots that have a purchase price, with the count of priced Lots beside it |
| Net Flow (30d) | Receipts minus consumption over the last 30 days. Positive means stock is growing. |
| Open Orders | Drafts and confirmed orders, listed below |
Stock Value only counts Lots you have priced, which is why it says how many of your Lots that is. If your coffee is priced in more than one currency, each currency keeps its own total — Rostoc does not add them into a number that is money in none of them. Lots priced before Rostoc recorded currencies are counted separately and named in the subtitle.
Coffee Lines at Risk
Section titled “Coffee Lines at Risk”The Coffee Lines whose stock may not cover what is coming, worst coverage first: run-out in weeks, coverage in days, stock, and weekly usage. Click a row to open that Coffee Line.
Orders
Section titled “Orders”Every order and the state it is in — Draft while you decide, On order once confirmed, Received when the coffee has landed. Filter by state, and click a row to finish, receive, or review it. Ordering and receiving are covered in Green Inventory.
Usage & History
Section titled “Usage & History”Usage over 30 days with the last 7 days beside it, your average monthly usage, and 30-day flow broken into what came in and what went out.
Below it, Stock & Transaction History charts six months in two views:
- Stock level — a stepped line showing total stock over time
- Transaction flow — monthly bars broken down by receipts, roast consumption, manual adjustments, transfers, and roast reversals
Hover over any point to see exact values for that period.
Movements
Section titled “Movements”The ledger: every receipt, roast, adjustment, split, and transfer that changed your stock, newest first, with the date, type, coffee, weight, reason, and who did it. Filter by type, and scroll to load more.
This is where a number on this page comes from. A roast movement names the Plan and the Batch code behind it, so a figure you do not recognise can be traced to the roast that made it.
Download a snapshot
Section titled “Download a snapshot”Click the ⋯ menu in the page header, then Download snapshot…, to download stock and value per coffee line as a CSV — built for handing to someone outside Rostoc, like an accountant closing the month or an insurer. There’s no lot-level detail in it, only each coffee line, its stock, and its value.
The dialog opens with today’s date already selected, so downloading current numbers takes one click on Download. Pick an earlier date instead to get stock and value as they stood at the end of that day — Rostoc reconstructs the balance from your transaction history rather than using today’s numbers, so a lot you’ve since sold through still counts correctly for a date when you still held it.
If your coffee is priced in more than one currency, each currency gets its own total in the file rather than being added together.
Empty state
Section titled “Empty state”If you haven’t added any green coffee yet, the dashboard shows a prompt to get started. Click Go to Greens to add your first Coffee Line and Lots.
Related pages
Section titled “Related pages”- Green Inventory — Manage Coffee Lines, Lots, and Warehouses
- Roast Studio — See how roasts consume inventory
- Plans — Plan roasts with stock-aware scheduling
- Web App — Review inventory from a browser
- Export Your Data — The other ways to get data out of Rostoc