

Batch Details
The batch detail view shows everything recorded during a single roast: the full curve, key temperatures, weight data, and any notes. Open it by clicking a row in the Batches list or in the history table inside a plan.
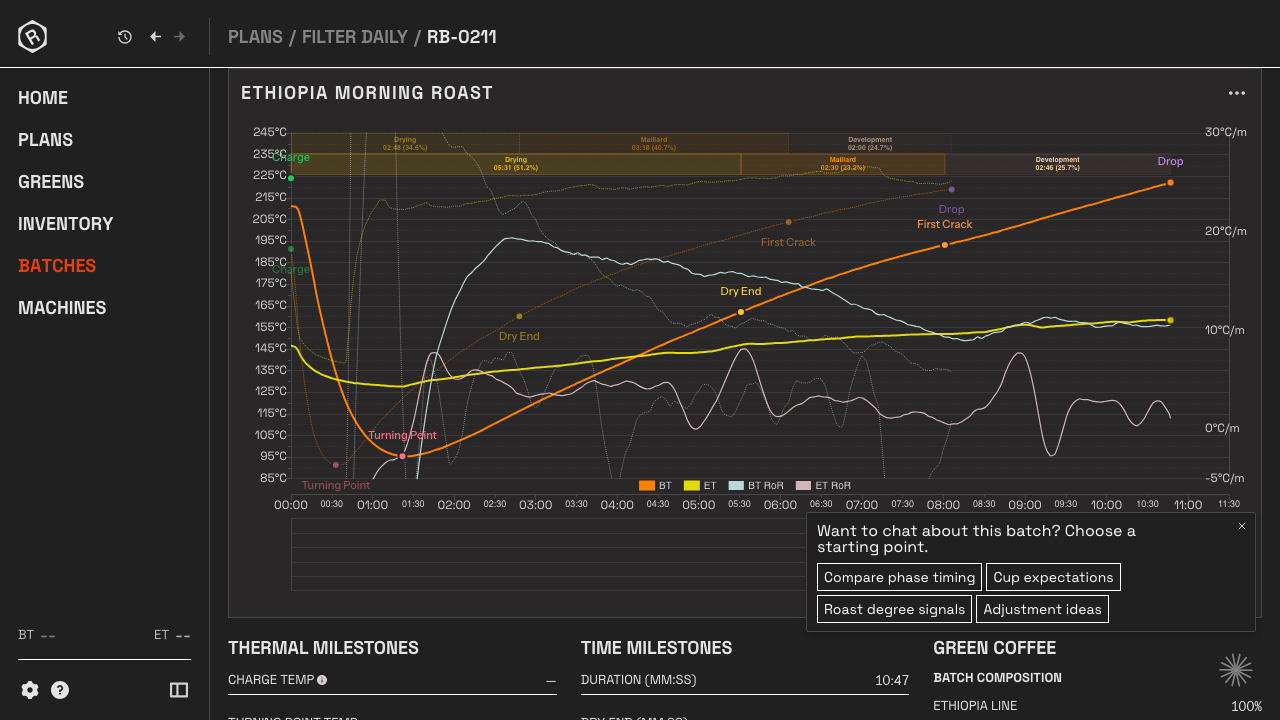
At the top you’ll see the key numbers from this roast: how much coffee went in and came out (and the weight loss percentage between them), the charge and drop temperatures, and the timing of each development phase — dry end, first crack, and total duration. The DTR (Development Time Ratio) tells you what percentage of the roast happened after first crack; roasters use it as a shorthand for how developed the coffee is likely to taste.
If the batch was roasted against a plan, the plan name is shown here as a link back to it.
Below the stats, the temperature chart shows time on the x-axis and all connected sensor channels on the y-axis. Key events (charge, turning point, dry end, first crack, drop) are marked as vertical lines on the chart.
If the batch was roasted against a plan that has a reference curve, the reference overlay appears in a muted colour so you can compare your actual roast against the target.
Roaster and notes
Section titled “Roaster and notes”Below the chart you’ll see the Roaster name — the person who ran the roast, if recorded — and a Notes section with any post-roast observations. If a roast colour was measured, a Colour field sits alongside them.
If the machine brand and model were captured, a Machine Info section shows them at the bottom of the page.
Edit a batch
Section titled “Edit a batch”Edit batch is the primary button in the page header, beside Actions.
You’ll usually reach it straight from the roast. When a recording finishes, the Batch Created confirmation leads with Review batch, which opens this page with the edit dialog already open. Rostoc fills the output weight in from your plan where it can, so this is the moment to enter what the scale says. The confirmation clears after a few seconds; if it has gone, open the batch and click Edit batch.
The dialog holds the roast record:
- Output Weight — what came out, weighed
- Colour Reading and Colour Scale — a roast colour measured after the roast, on the Agtron or Colortrack scale
- Notes — post-roast observations
- Roaster Name — the operator who ran the roast, not the Machine
Charge and drop temperature cannot be edited. They are recorded from the roast itself and shown on the page under Thermal milestones. Weight Loss % is worked out from the input and output weights and appears under Roast Weights.
Adjust green coffee and inventory
Section titled “Adjust green coffee and inventory”Green coffee is not in the edit dialog. Adjust green & inventory, at the bottom of it, opens a second dialog that owns everything the roast took out of stock:
- the Roasting Plan the batch is filed under
- Input Weight — what the roast consumed
- the batch composition, with each Coffee Line and its percentage in a blend
- the Lot each component drew from
- a Reason for the correction
These sit apart because changing any of them moves stock. The dialog shows the inventory change it is about to make before you save, and records your reason against the stock movement.
If the batch consumed stock from a Lot, the batch page shows it under Green Coffee, as Inventory consumption.
Set as reference curve
Section titled “Set as reference curve”If the batch belongs to a Roasting Plan, a star icon appears in the page header, leading the button cluster with Actions and Edit batch.
- Click the star to set this batch as the plan’s Reference Curve.
- Click it again to remove it as the reference.
The star is amber when this batch is the current reference, and grey otherwise. It follows the batch rather than the route you took: a roast made from a plan shows the star whether you opened it from that plan’s history table or from the Batches list. A batch with no plan has no star.
Share as an image
Section titled “Share as an image”Click the … button in the corner of the Curve card and choose Share chart. The Share Roast dialog opens with a preview of the image, and checkboxes to include or hide the Reference curve overlay and the Actions markers. Click Export PNG to save the image — it comes out with Rostoc branding, ready to post or send to a customer.
Export the data
Section titled “Export the data”Click Actions in the page header, then Export as CSV or Export as JSON, to download the roast’s full data table instead of an image — useful for opening in a spreadsheet or feeding into another tool.
Both formats carry every channel your machine recorded — bean and environment temperature, gas, airflow, drum speed, whatever your setup reports — plus the roast’s milestones and any control changes you made during the roast, all on one timeline. CSV is the one a spreadsheet opens directly; JSON keeps each channel’s unit and role attached to the numbers. The download starts immediately, and the file is named after the roast.
See Export Your Data for the other ways to get your roasting data out of Rostoc.
Delete a batch
Section titled “Delete a batch”Click Edit batch in the page header, then Delete Batch at the bottom-left of the dialog. A confirmation step appears before anything is removed.
Deleting a batch permanently removes its curve data. The Plan it was linked to is not affected.