How to read a coffee roast profile
Two batches of the same coffee taste different. You open their roast graphs and find a screen full of lines, markers, and percentages. Where should you look first?
Updated October 3, 2026 | Rostoc
A roast profile helps you retrace what happened. Start with time and temperature, find the recorded milestones, then look at the changes you made along the way. Put that beside the coffee lot, charge weight, and tasting notes, and the graph becomes much easier to use.
You don't need to interpret every line at once. We'll read the main parts in order, then use them to choose a useful comparison for your next batch.
1. Start with the axes and legend
The horizontal axis usually shows elapsed roast time. Temperature traces use a temperature axis, with units such as °C or °F. Rate of rise, when shown, needs a separate scale because it measures temperature change per unit of time.
Check the legend before following a line. Bean temperature, environmental temperature, and incoming air temperature refer to different measurements. A label such as “environmental” needs the machine's sensor location to make it meaningful. Mill City's own documentation, for example, identifies distinct positions for these sensors on its roasters. Sensor placement explanation
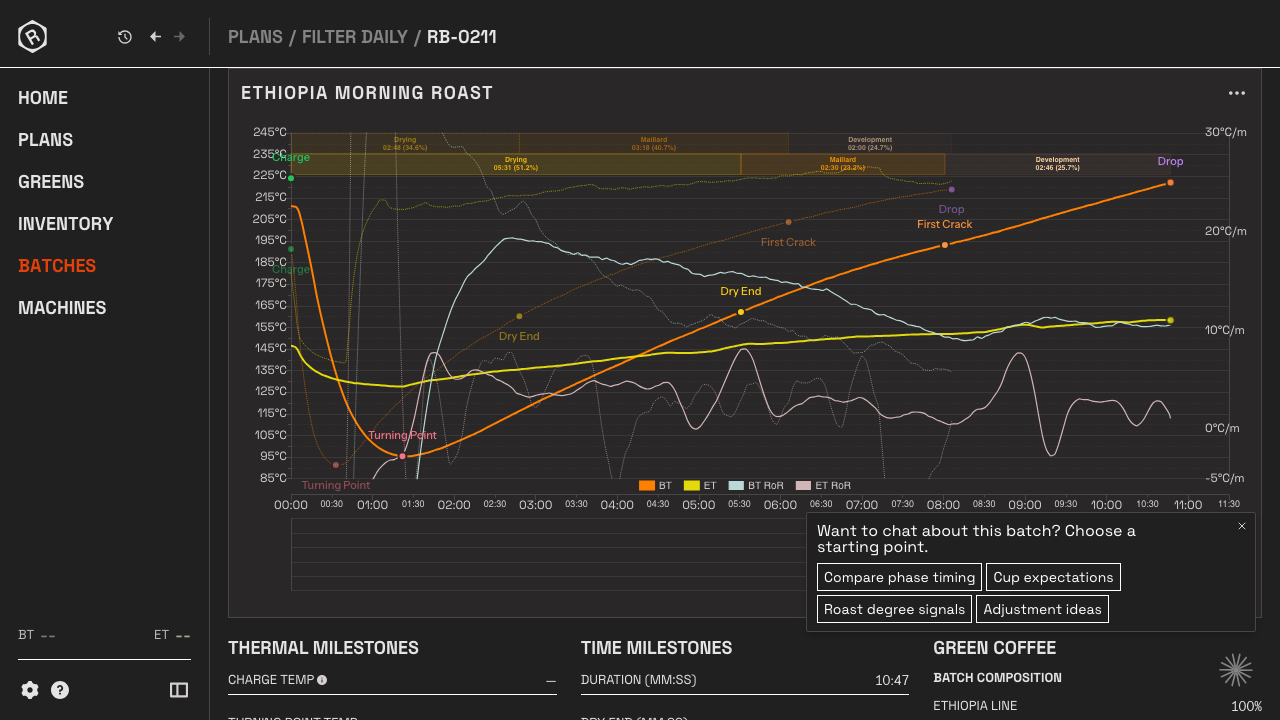
Rostoc's batch detail view with a reference overlay. The legend identifies BT, ET, BT RoR, and ET RoR; event markers show where the recorded milestones occurred. This is a documentation example, not a recommended roast recipe.
In this screenshot, temperature is read from the left axis and rate of rise from the right. The orange BT line is the main bean-temperature trace; the yellow ET line is the environmental-temperature reading. The pale BT RoR line uses the rate scale. Fainter traces and a second set of markers show the reference overlay, so check which batch you are following before comparing times.
2. Know what the temperature reading represents
A temperature trace is the output of a sensor in a particular setup. Keep the machine, sensor position, batch load, and recording settings alongside the graph when comparing it with another roast.
This matters especially when borrowing a profile from a different machine. Before treating a temperature as a target, ask what measured it and where. Identical labels do not establish identical measurement conditions.
Your probe has a personality
Mill City explains that thinner thermocouples can respond faster while also showing more noise, and offers probes with adjustable insertion depth. The practical implication is that a changed trace may reflect the measurement setup as well as the roast. Keep that context when comparing machines or changing a probe. Probe response, adjustable thermocouples
If you change a probe or a display setting, leave a note with the record. When the next curve looks different, you'll know there is a measurement change to consider alongside the roast itself.
3. Use landmarks to organise the roast
Event markers make a long temperature trace easier to read. Common landmarks include:
| Marker | What it records |
|---|---|
| Charge | Coffee entering the roasting chamber |
| Yellowing | The operator's observation of the colour transition |
| First crack | The recorded onset of the first-crack event |
| Drop | Coffee leaving the roasting chamber |
Agree what your team means by each marker. If one person marks the first isolated crack and another waits for a sustained series, their development times begin at different moments. A shared convention makes comparisons easier; leave a note when a milestone was hard to identify.
Phase labels help divide the record into manageable intervals. They are useful conventions for describing the roast, rather than evidence that one chemical process switches off as another begins. For this guide, the interval from the recorded first-crack marker to drop is the development time.
Then look for actions such as heat and airflow changes. Note the time and actual setting where available. Read forward from the change to see what the measured trace did next. This helps you ask a specific question, such as whether you made an adjustment earlier in one batch than the other.
4. Read rate of rise as a rate
Rate of rise, often shortened to RoR, describes how quickly the recorded temperature changes. A positive rate means the temperature reading is rising; a falling positive rate means it is still rising, but more slowly.
Here is a simple interval calculation using invented readings:
| Time | Recorded temperature |
|---|---|
| 6:00 | 170 °C |
| 6:30 | 174 °C |
The temperature increased by 4 °C over half a minute. That is an average rate of 8 °C per minute for this interval: 4 ÷ 0.5 = 8.
Your software may calculate RoR over a different interval or smooth the result, so its line can differ from this simple average. When comparing batches, use consistent settings where possible and check them if a line suddenly looks smoother or more jagged.
When RoR changes sharply, return to the temperature trace and the action markers. Did the reading jump? Was a setting changed? Does the same pattern appear in the reference? Use the line to narrow the question, then check the result in the cup.
The same percentage can describe different timings
Ninety seconds of development in a ten-minute roast equals 15%. So does 135 seconds in a fifteen-minute roast. The ratio matches, but the elapsed times differ. Keep first-crack time, development time, and total time beside the percentage. This arithmetic does not establish which roast tastes better.
5. Compare batches with their results beside them
Choose a reference batch you liked, ideally from the same lot, machine setup, and similar charge weight. Write down anything that differs. That gives you a comparison you can learn from without forgetting that the two batches had different starting conditions.
Look at landmark times, measured temperatures, and actions. Include charge and finished weights. Then bring in colour measurements if you use them, and tasting observations gathered through a consistent method.
Research supports looking beyond timing alone. A multi-study investigation published in Beverages in 2020 found roast colour was a stronger predictor of sensory variation than timing in its comparisons, while timing changes at the same colour also affected flavour. That supports considering both; it does not supply a preferred curve for every coffee. Full research paper
For example, ‘batch B had less fruit intensity in the same cupping session’ is more useful than ‘B was worse.’ If B also reached first crack later, you have a question to investigate—not proof that the timing caused the difference. Pick one deliberate change for a follow-up batch and keep the other conditions as consistent as practical.
A short profile-reading routine
- Check time, temperature units, and the trace legend.
- Identify sensor locations and the batch context.
- Locate charge, observed landmarks, and drop.
- Read operator changes alongside the measured response.
- Interpret RoR using its units and display settings.
- Compare elapsed times as well as percentages.
- Keep the graph beside colour and tasting observations where available.
Make the next comparison easier to find
Rostoc keeps roast profiles, reference curves, plans, and notes organised, with machine setup and charge context connected to the plan. That gives you a place to return to the reference you want and review it alongside the next batch.
Explore roast profiles and plans in Rostoc. For the other half of a useful comparison—knowing which delivery supplied each batch—read our green coffee inventory guide.